

Jim Kaste was walking his dog when he tripped on a whale bone.
It was actually a fossilized whale bone, a fairly common fossil on the Virginia Peninsula, which in geologic time was beneath the ocean.
“Rick had found that whale bones were hot,” Kaste said. “They have high uranium and high radon levels.”
Rick is Carl “Rick” Berquist, a research associate with William & Mary’s Department of Geology, where Kaste is a professor. Berquist had been working since 1989 on mapping the presence of dangerous radon gas in and around Williamsburg, an initiative that often involved William & Mary undergrads.
“So, I’m looking at this bone, down at my feet. I picked it up and brought it to my lab,” Kaste said. The bone went into Kaste’s lead-cocooned gamma detector, which he uses to measure radiation levels in samples of everything from rocks to food.
“And the bone was one of the most radioactive natural samples I’ve ever measured,” he said. “There was so much uranium in there that it’s almost at the mining grade — that’s how much uranium is in that bone. And that really blew me away.”
Kaste teamed up with Berquist to continue mapping the hot spots of the Williamsburg area and testing homes for the presence of potentially dangerous radon gas. Radon gas comes from the natural decay of uranium and radium; it’s been cited as the second-leading cause of lung cancer, after smoking.
The problem with the standard risk maps
The Williamsburg area—and the Virginia coastal plain—are shown as “low risk” on county-level radon-risk maps used by the Virginia Department of Health and assembled from data from the U.S. Geological Survey and the Environmental Protection Agency. But the maps are incomplete: Berquist and Kaste have found that many buildings in the Williamsburg-York-James City Historic Triangle have serious radon gas infiltration.
Radon gas is measured in picocuries per liter of air — abbreviated as “pCi/L.” The EPA/VDH map shows three radon zones, color-coded red, orange and yellow. Counties and cities in the eastern portion of the state, from the Northern Neck to Virginia Beach, and west to I-95, are colored yellow. Yellow denotes radon risk Zone 3: “Low Potential (less than 2 pCi/L).”
West of the I-95 corridor is a red “high potential” belt (“greater than 4 pCi/l”). There’s a one county-wide orange (“from 2 to 4 pCi/l”) moderate-potential belt that stretches from Loudoun through Charlottesville and down to the North Carolina border.
“But radon doesn’t care where the county line is,” Kaste said. “No matter what the map says, the threshold for what you should worry about is four picocuries per liter. Rick has found homes in Williamsburg, in James City County, in York County and in New Kent County that are five and six times above the action level.”
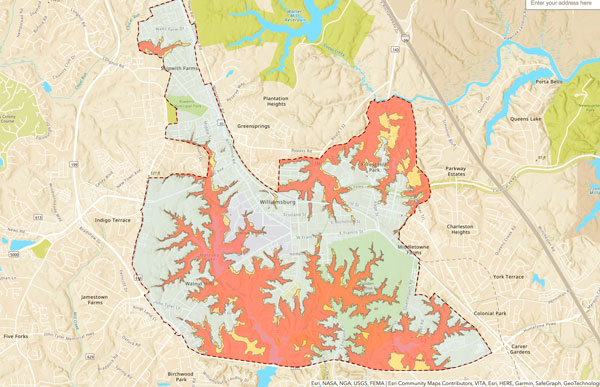
The radon project was advanced by funding from the Commonwealth Center for Energy and the Environment, a William & Mary entity that supports promising research with seed money. The radon researchers have put together a fine-scale interactive map of the City of Williamsburg, showing precisely what areas sit atop the Yorktown Formation, a geologic feature that Berquist determined was the source of radon gas in the region. Williamsburg residents can find their homes on the storymap and see if their homes are atop the Yorktown Formation.
Berquist and Kaste have tested around 200 homes in the Williamsburg area since 2001. They have found that 15 percent of homes in the 23185 Zip code and 39 percent of the homes in the 23188 Zip code tested above the action level of four picocuries per liter.
Incorporated into Hazard Mitigation Plan
That Williamsburg map and their findings to date are incorporated into the updated Hampton Roads Hazard Mitigation Plan, slated to be released in a final version by the Hampton Roads Planning District Commission in spring of 2022.
Berquist and Kaste hope that their work will generate public awareness about the dangers of radon gas in hopes and it will result in radon testing becoming more widespread on the Peninsula.
“Public awareness of radon is nearly zero,” Kaste said.
Berquist was an active adjunct faculty member of the geology department until the early 2000s. He began studies in 1989 that allowed him to trace the radon gas in the area to an underground geologic feature known as the Yorktown Formation. He read an article in the old Newport News Times-Herald about a number of homes on the Peninsula that had excessive radon gas infiltration in their homes.
“It occurred to me that there’s something going on in James City County and Williamsburg,” Berquist said. “I put two and two together and thought maybe the Yorktown Formation, which carries these whale bones in great quantity, might be the culprit.”
Berquist started going radon prospecting around the area. His earliest assistants were students who were participating in the National Science Foundation’s Research Experiences program for undergraduates. REUs provide students summer research opportunities that might not otherwise be available to them at their schools.
Berquist recalled that his first assistant was an REU student from James Madison University. The second was a William & Mary geology major who made radon work the focus of her senior thesis. Then more and more REU students and more and more W&M geology majors jointed the team.
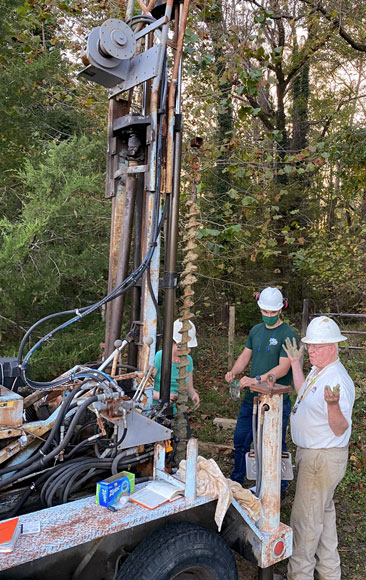
“We put wells in the ground, little short wells that we drilled by hand, and then we hung typical indoor radon detectors down in the wells. That’s all we had,” he said. “There is a charcoal insert. The charcoal absorbs the gas, and then you send the units off to get the reading. We also tested many homes adjacent to the wells, for statistical comparison.”
Berquist and his radon-hunting undergraduates also used a handheld gamma spectrometer. “It’s like a Geiger counter, but you can tune it for different elements,” he said. “That wasn’t very productive.”
But the wells paid off. Berquist even remembers the REU undergraduate that made the vital connection.
“Jennifer Cooper was her name. She’s now Jennifer Cooper Healy. She was a REU student from James Madison,” he said. “She discovered that these wells were getting more radon in the Yorktown Formation than anywhere else.”
An undergraduate-driven project
Undergraduates have been active participants in radon mapping and testing from the start and the radon project has fueled many a William & Mary geology senior thesis. Dorian Miller ’22 is one of the most recent. The project involves three aspects: taking readings and samples in the field, prepping and analysis in the lab and the mapping. Miller was involved in all three aspects. It all started in a geosciences GIS class his sophomore year.
“We had to do a final project for that class, like creating some kind of a map visualization. And the professor reached out to me and said, ‘Hey, there’s someone doing research here on radon and all these things, and they’re looking for someone with GIS experience.’” Miller recalled. “I’d taken a couple of GIS classes at that point, doing mapping and things. And I said, ‘Sure. Sign me up.’”
The radon mapping became Miller’s final project for the GIS class, and it evolved into his senior thesis topic for his geology major. He is a co-author, along with Kaste and Berquist, on the story map “Radon in Williamsburg Area Homes,” which summarizes the radon findings to date.
But Miller said that his favorite part of the project was field work: “You know, the actual geology. Put the hard hat on and get out there with the drill rig.”
Miller and the other hard-hatted geologists drill to find the extent of the Yorktown Formation, basically a compressed assembly of sand, clay and shell sediment. The defining characteristic of the Yorktown Formation is that it’s loaded with fossils. But Kaste says that not all the fossils of the Yorktown Formation are radioactive, like the whalebone fossil he tripped over.
“Whale bones are typically high in uranium and are big sources of radon gas. We’ve also found other fossils that have radon-producing materials,” he said. “But the shellfish fossils, like Chesapecten jeffersonius —Virginia’s state fossil — are clean.”
Chesapecten is an extinct scallop. Kaste explained that its fossils, like other shells, are calcium carbonate, not chemically conducive to absorbing uranium over the millennia.
“Other fossils are phosphate. Phosphate is the molecule that bonds to the uranium,” he said. “Bones and teeth are phosphate. And certain brachiopods. Those are the ones with uranium in them.”
Berquist and Kaste explain that although fossils are larded throughout the Yorktown Formation, the Yorktown Formation doesn’t extend uniformly throughout the region. But they also point out maps, such as the EPA’s Radon Zone map issued by the Virginia Department of Health, don’t account for local radon gas “hot spots” like those atop the Yorktown Formation. Berquist notes that the composition of the Yorktown changes laterally and vertically.
“I have mapped Yorktown sediments from below the Eastern Shore west to Richmond and from North Carolina to the Northern Neck,” Berquist said. “I know radon is a problem in Williamsburg and Gloucester, York, James City, New Kent and Surry Counties. But I haven’t looked at data beyond that.”
“The EPA made a very coarse geological model that equates the general rock type of the area to the tendency of radon presence,” Kaste explained. “For example, black shales — really dark shales — and granites tend to have radon. But what’s important about these color codes is that they drive housing policy.”
Kaste said he isn’t aware of any Virginia municipality that requires radon testing before an existing home can be sold. Counties and cities in the red zone do have the option of including radon-reduction measures into their building codes governing new construction, and a few municipalities in the red zone have done so.
“But what we’re finding is that a yellow county doesn’t necessarily mean you don’t have a radon problem in your home,” he added.
Their map shows that most of the William & Mary campus buildings are not atop the Yorktown Formation, and the team has tested some of the buildings that are in higher radon risk areas.
“A student and I tested the Keck Lab and a room in Adair,” Berquist said. “The radon was under four picocuries per liter. Boswell is in a high-risk zone. So is Adair, but building construction must be keeping the radon out.”
Actual radon levels depend on many variables
Building construction is one of the variables that determine the degree of radon gas infiltration. Building design is another. Kaste gives the example of homes on his street. His house is built on a slab and regularly gives levels between two and three picocuries per liter.
“But I went to a nearby neighbor’s house,” he said. “Their house is lower in elevation than mine and they tested at 12.”
Kaste said he thinks the difference in radon levels between him and his neighbor might be due to two factors. The first is the difference in elevation: the neighbor house is that much closer to the uranium-soaked fossils of the Yorktown Formation. In general, the project has found that Williamsburg-area homes built at elevations between 64 and 58 feet to have moderate radon risk. Homes built below 58 feet are found to have the greatest risk.
The second difference between Kaste’s house and his neighbor’s is that the neighbor has a walk-out basement.
“Think about it,” Kaste said. “You’ve got your basement that’s open on one side and the other side is up against all that dirt.”
“And not every house that has a walkout basement, and that’s located in the Yorktown will have high radon,” Berquist said. “We’ve seen homes with walkout basements. They don’t have a radon problem — and they are in the Yorktown. That’s why are we call our map a ‘risk map.’ We’re not saying you have radon; we’re saying that you have a higher risk if you live in a certain area.”
Kaste said homeowners have a number of testing options. There are a number of radon-testing firms and DIY kits are available at hardware stores and through the Virginia Department of Health. Mitigation of actionable levels of radon gas can be quite simple, often through increased ventilation of problem areas.
“The best time to test for radon is in the wintertime when your home is closed up. That’s when it’ll be the worst,” Berquist said. “I let my detectors run for two weeks. The reason for that is to average in the storm events, the low-pressure events that come in and go out. If you can average those out with a two-week test, you get a much more accurate reading for the home.”
Joseph McClain, Research Writer